2 – Work file 18: How to analyse and interpret EDC/HRE evaluation results
Living Democracy » Textbooks » Educating for democracy » Part 2 – Teaching democracy and human rights » Unit 5 – Assessment of students, teachers and schools » 2. Task and key questions for assessment of students, teachers and schools » 2 – Work file 18: How to analyse and interpret EDC/HRE evaluation resultsThere are many ways to analyse, categorise and interpret evaluation results. When using the set of quality indicators for EDC/HRE suggested in Work file 12, one of the most effective and easiest ways is to start identifying strengths and weaknesses in EDC/HRE. The Council of Europe suggests using a four-level scale for this purpose and thus basing each indicator according to this scale (Council of Europe, Democratic Governance of Schools, 2005, p. 88):
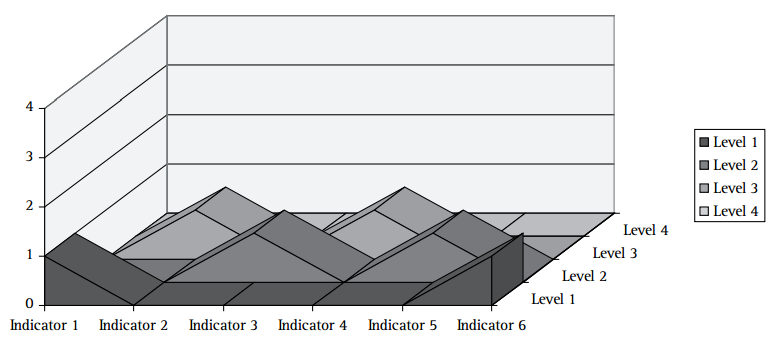
- Level 1 – significant weakness in most or all areas;
- Level 2 – more weaknesses than strengths;
- Level 3 – more strengths than weaknesses;
- Level 4 – strengths in most or all areas and no significant weaknesses.
One possible way to present the results out of such an analysis is using diagrams which show the overall performance in EDC/HRE but also list the different indicators. The example below of a fictional school illustrates this:
When trying to come to a conclusion, this should cover four basic areas (ibid., p. 91):
- the school’s achievement in EDC/HRE in general;
- the school’s position on each quality indicator;
- the most successful and the weakest aspects of EDC/HRE in the school;
- the most critical points that may threaten further development of EDC/HRE in a school.
- Educating for democracy (I)
- Introduction
- Part 1 - Understanding democracy and human rights
- Unit 1 – What the concepts mean
- Unit 2 – The key to a dynamic concept of citizenship11
- Unit 3 - Educating for democracy and human rights
- 1. The three dimensions of EDC/HRE
- 2. HRE and its connection with EDC13
- 3. Competences in EDC/HRE
- 4. “We create the world in our minds”: constructivist learning in EDC/HRE16
- 5. Professional ethics of EDC/HRE teachers: three principles
- 6. Key concepts in EDC/HRE
- 7. The method carries the message: task-based learning in EDC/HRE
- 7.1 The shortcomings of traditional citizenship education
- 7.2 Teaching though and for democracy and human rights requires active learning
- 7.3 Tasks – the teacher’s tool to support active learning
- 7.4 Task-based learning is problem-based learning
- 7.5 The teacher’s roles in task-based learning sequences
- 7.6 Active learning requires a follow-up
- 8. A human rights-based approach to schooling23
- Unit 4 - Education for Democratic Citizenship and Human Rights Education – A short history of the Council of Europe approach26
- Part 2 - Teaching democracy and human rights
- Unit 1 - Conditions of teaching and learning
- 1. Introduction
- 2. Task and key questions for conditions of teaching and learning
- 2 - Work file 1: How to take students’ skills and knowledge into account
- 2 - Work file 2: How to take my teaching skills and knowledge into account
- 2 - Work file 3: Considering general teaching and learning conditions
- 2 - Work file 4: What are my basic attitudes towards students?
- 2 - Work file 5: Rethinking discipline and order from a democratic point of view
- 2 - Work file 6: Rethinking the teacher’s role from a democratic point of view
- 2 - Work file 7: How to develop a democratic atmosphere in the classroom
- 2 - Work file 8: How to develop school as a democratic community
- Unit 2 - Setting objectives and selecting materials
- Unit 3 - Understanding politics
- Unit 4 - Guiding processes of learning and choosing forms of teaching
- 1. Introduction
- 2. Task and key questions for guiding processes of learning and choosing forms of teaching
- 2.1 Task
- 2.2 Key questions
- 2 - Work file 1: Three stages in a learning process
- 2 - Work file 2: Why chalk and talk is not enough, or “taught ≠ learned” and “learned ≠ applied in real life”
- 2 - Work file 3: Selecting adequate forms of teaching and learning
- 2 - Work file 4: Five basic forms of teaching and learning
- Unit 5 - Assessment of students, teachers and schools
- 1. Introduction
- 2. Task and key questions for assessment of students, teachers and schools
- 2.1 Task
- 2.2 Key questions
- 2 - Work file 1: Different dimensions of assessment
- 2 - Work file 2: Perspectives of assessment
- 2 - Work file 3: Perspectives and forms of assessment
- 2 - Work file 4: Standards of reference
- 2 - Work file 5: Assessment of students – the influence of assessment on self-concepts
- 2 - Work file 6: Checklist “How do I assess my students?”
- 2 - Work file 7: Assessment of teachers
- 2 - Work file 8: Self-assessment of teachers
- 2 - Work file 9: Working with journals, logbooks, portfolios37
- 2 - Work file 10: Co-operative teaching and peer feedback
- 2 - Work file 11: Assessment of EDC/HRE in schools
- 2 - Work file 12: Quality indicators of EDC/HRE in a school
- 2 - Work file 13: General principles for evaluating EDC/HRE
- 2 - Work file 14: Guidelines for self-evaluation of schools
- 2 - Work file 15: Involving the different stakeholders in evaluating EDC/HRE in a school
- 2 - Work file 16: Governance and management in a school46
- 2 - Work file 17: Focus on democratic school governance
- 2 - Work file 18: How to analyse and interpret EDC/HRE evaluation results
- Part 3 - Tools for teaching and learning democracy and human rights
- Unit 1 - Toolbox for teachers
- Unit 2 - Toolbox for students
- 1. Introduction
- Tool 1: Worksheet for students to plan their learning schedules
- Tool 2: Worksheet for students to reflect on their learning
- Tool 3: Worksheet for students to reflect on their achievement
- Tool 4: Researching in libraries
- Tool 5: Researching on the Internet
- Tool 6: Carrying out interviews and surveys
- Tool 7: Interpreting images
- Tool 8: Mind maps
- Tool 9: Creating posters
- Tool 10: Holding exhibitions
- Tool 11: Planning and giving presentations
- Tool 12: Preparing overhead transparencies or a PowerPoint presentation
- Tool 13: Writing newspaper articles
- Tool 14: Putting on performances
- Tool 15: Holding debates
- Growing up in democracy (II)
- Introduction
- Unit 1: Identity – Me in my community
- UNIT 2: Diversity and pluralism – At home in Europe
- UNIT 3: Equality – Minorities and majorities
- UNIT 4: Conflict – Rules help to solve conflicts
- UNIT 5: Rules and law – The basis of living together
- UNIT 6: Power and authority – I am the boss! Am I?
- UNIT 7: Responsibility – I go eco … my school takes part!
- UNIT 8: Rights and freedom – My rights – your rights
- UNIT 9: Media - Media in use: I would if I could
- Manual for students
- I. Handouts for students - Introduction
- Student handout for Unit 1, lesson 1: “I like and don’t like” table
- Student handout for Unit 1, lessons 2 and 3: Coat of arms template
- Student handout for Unit 1, lesson 4: 3-step discussion
- Student handout for Unit 2, lesson 1: Map of Europe (enlarge it to A3)
- Student handout for Unit 2, lesson 1: The countries and capitals of Europe
- Student handout for Unit 2, lesson 1: The flags of Europe
- Student handout for Unit 2, lesson 1: Rivers in Europe
- Student handout for Unit 2, lesson 1: Mountains and landforms in Europe
- Student handout for Unit 2, lessons 2 and 3: Country portrait
- Student handout for Unit 3, lesson 2: Table for notes
- Student handout for Unit 3, lesson 3: Statistics sheet
- Student handout for Unit 3, lesson 4: Word and power cards
- Student handout for Unit 4, lesson 1: Our problem – my problem
- Student handout for Unit 4, lesson 3: Voting cards
- Student handout for Unit 5, lesson 1: Rights, responsibilities and rules in our school
- Student handout for Unit 5, lesson 3: Voting cards
- Student handout for Unit 5, lesson 4: Criteria for good rules
- Student handout for Unit 6, lesson 1: Superhero?
- Student handout for Unit 6, lesson 2: Schema of political representation
- Student handout for Unit 6, lesson 3: Election information
- Student handout for Unit 7, lesson 1: Responsibility for what?
- Student handout for Unit 7, lesson 4: Who has what kind of responsibility?
- Student handout for Unit 8, lesson 1: Task to decide between “WANTS” and “NEEDS”
- Student handout for Unit 8, lesson 2: Human rights: a list for comparing rights and needs
- Student handout for Unit 8, lesson 3: Survey on human rights
- Student handout for Unit 9, lesson 1: Presentation cards giving a short description of the media devices
- II. Toolbox for students - Introduction
- 1. Researching in libraries
- 2. Researching on the Internet
- 3. Carrying out interviews and surveys
- 4. Interpreting images
- 5. Mind maps
- 6. Creating posters
- 7. Holding exhibitions
- 8. Planning and giving presentations
- 9. Preparing overhead transparencies or a PowerPoint presentation
- 10. Writing newspaper articles
- 11. Putting on performances
- 12. Holding debates
- Living in democracy (III)
- Introduction
- Part 1: Individual and community
- UNIT 1: Stereotypes and prejudices
- Lesson 1: How others see a person
- Lesson 2: How differently a person can be described...
- Lesson 3: Stereotypes and prejudices
- Lesson 4: Identity - Stereotypes about me!
- Student handout 1.1: (Group 1) Role play
- Student handout 1.1: (Group 2) Role play
- Student handout 1.1: (Group 3) Role play
- Background material for teachers: Stereotypes and prejudices
- Student handout 1.2: Self-perception – perception by others
- UNIT 2: Equality - Are you more equal than me?
- UNIT 3: Diversity and pluralism - How can people live together peacefully?
- Lesson 1: How can people live together?
- Lesson 2: Why do people disagree?
- Lesson 3: In what ways are people different?
- Lesson 4: Why are human rights important?
- Student handout 3.1: The school on the edge of the forest
- Student handout 3.2: Hope is for everyone
- Student handout 3.3: Help for Hope College
- Student handout 3.4 - The islanders and the settlers (role cards)
- Student handout 3.5: Situation cards: the islanders
- Student handout 3.6: Key elements of human rights15
- UNIT 4: Conflict
- Lesson 1: Conflict resolution
- Lesson 2: Applying the six-step approach
- Lesson 3: Conflicting human rights
- Lesson 4: Using violence
- Teacher’s resource sheet: International humanitarian law
- Student handout 4.1: A six-step approach to conflict resolution
- Student handout 4.2: Conflict scenarios
- Student handout 4.3: Five cases of conflicting human rights
- Student handout 4.4: Is violence acceptable in some cases?
- Part 2: Taking responsibility
- UNIT 5: Rights, liberties and responsibilities
- Lesson 1: Wishes, basic needs, human dignity and human rights
- Lesson 2: Detecting human rights violations
- Lesson 3: Rights and responsibilities
- Lesson 4: Human rights quiz
- Student handout 5.1: Wishes, needs and rights
- Student handout 5.2: List of human rights
- Student handout 5.3: Cases of human rights violations
- Student handout 5.4: Rights and responsibilities
- Student handout 5.5: Human rights quiz (training cards)
- Teacher’s resource sheet
- UNIT 6: Responsibility
- Lesson 1: Responsibilities at home
- Lesson 2: Why should people obey the law?
- Lesson 3: Whose problem is it?
- Lesson 4: Why do people become active citizens?
- Student handout 6.1: Milan makes a choice
- Student handout 6.2: Schmitt’s dilemma
- Student handout 6.3: Things are getting out of control!
- Student handout 6.4: Card sort: the life of Jelena Santic
- Part 3: Participation
- Part 4: Power and authority
- UNIT 8: Rules and Law
- Lesson 1: Good law – bad law
- Lesson 2: At what age?
- Lesson 3: You make the law
- Lesson 4: Rules of evidence
- Student handout 8.1: A questionnaire: at what age?
- Student handout 8.2: Discussion cards
- 8.1 Background information for teachers: Integration, not criminalisation
- 8.2 Background information for teachers: Convention on the Rights of the Child
- UNIT 9: Government and politics
- Taking part in democracy (IV)
- Introduction
- Interactive constructivist learning in EDC/HRE
- Part 1: Taking part in the community
- UNIT 1: IDENTITY
- Lesson 1: Views on choices and identity
- Lesson 2: Looking back: what choices made me the person I am?
- Lesson 3: Looking forward: three choices that shape our future lives
- Lesson 4: Which job suits me?
- Materials for teachers 1.1: Quotes on choices and identity
- Materials for teachers 1.2: Job cards
- Unit 1.3: Background information for teachers
- UNIT 2: RESPONSIBILITY
- Lesson 1: Risk losing a friend – or break a rule?
- Lessons 2 and 3: What would you do?
- Lesson 4: What values must we share?
- Materials for teachers 2.1: How to use the tool for dilemma analysis
- Materials for teachers 2.2: Flipchart layout for the comparison of dilemma solutions (lesson 4)
- Materials for teachers 2.3: Liberty and responsibility - three lecture modules
- UNIT 3: DIVERSITY AND PLURALISM
- Lesson 1: If I were president …
- Lesson 2: What goals do we want to promote?
- Lesson 3: What is the common good?
- Lesson 4: Taking part in pluralist democracy
- Materials for teachers 3A: Four basic political standpoints
- Materials for teachers 3B: Lecture: what is the common good?
- Materials for teachers 3C: Suggestions for extensions and follow-ups
- Part 2 - Taking part in politics: settling conflict, solving problems
- UNIT 4: CONFLICT
- Lesson 1: The fishing game (1)
- Lesson 2: The fishing game (2)
- Lesson 3: How do we catch "as many fish as possible"?
- Lesson 4: How can we achieve sustainability?
- Materials for teachers 4.1: Fishing game: record sheet for players
- Materials for teachers (game managers) 4.2: Reproduction chart: recovery of the fish population (in tons of fish)
- Materials for teachers 4.3: Fishing game: record chart
- Materials for teachers 4.4: Fishing game: diagram of fish Stocks and total catches
- Materials for teachers 4.5: Homework Instructions (mini-handout for students)
- Unit 4.5: Background information for teachers: Reading list on the fishing game
- Unit 5: RULES AND LAW
- Unit 6: Government and politics
- Lesson 1: “Our most urgent problem is …”
- Lesson 2: Politics - how a democratic community solves its problems
- Lesson 3: Applying the policy cycle model
- Lesson 4: How can we take part?
- Lesson 5: Feedback session (optional)
- Materials for teachers 6.1: Illustration of the policy cycle model - how can we reduce the number of car accidents?
- Materials for teachers 6.2: Key statements on the policy cycle model
- UNIT 7: EQUALITY
- Part 3 - Taking part in politics: participation through communication
- Manual for students
- Student handout 1.1: What choices have made me the person I am today - and who made them?
- Student handout 1.2: Three options that shape our futures
- Student handout 1.3: My criteria for choosing a job
- Student handout 1.4: Questionnaire: job shadowing
- Student handout 2.1: The dilemma concept
- Student handout 2.2: A tool to analyse and solve dilemmas
- Student handout 2.3: How would you decide? Dilemma case stories
- Student handout 2.4: Record sheet on dilemma discussions (Based on student handout 2.3)
- Student handout 2.5: The Universal Declaration of Human Rights (10 December 1948)
- Student handout 2.6: Convention for the Protection of Human Rights and Fundamental Freedoms (The European Convention on Human Rights), as amended by Protocol No. 11 with Protocol Nos. 1, 4, 6 (excerpts)
- Student handout 3.1: Schedule for unit 3 “Diversity and pluralism”
- Student handout 3.2: Taking part in democracy – basic rules and principles
- Student handout 3.3: Establishing a political party
- Student handout 3.4: How does a democratic political system handle diversity and pluralism?
- Student handout 3.5: The concept of the common good: the hallmark of democracy and dictatorship
- Student handout 3.6: Map of social cleavages and political parties
- Student handout 4.1: Case story: the conflict in the fishing community
- Student handout 4.2: A model of sustainability goals
- Student handout 4.3: Applying the sustainability model to the fishing game: how do we “catch as many fish as possible”?
- Student handout 4.4: What is the optimum balance between fish reproduction and harvest?
- Student handout 5.1: Preparations for the conference on a framework of rules
- Student handout 5.2: Basic questions to consider in institutional design
- Student handout 5.3: Comparing frameworks of rules
- Student handout 5.4: Procedural rules for the conference – draft version
- Student handout 5.5: Summary: what can we learn through these games?
- Student handout 5.6: Feedback on units 4 and 5
- Student handout 6.1: The policy cycle model: politics as a process of solving problems in a community
- Student handout 6.2: The policy cycle – a tool to observe and understand political decision-making processes
- Student handout 6.3: Feedback on the unit “Government and politics”
- Student handout 7.1: Is majority rule unfair to the minority? A case story
- Student handout 7.2: How do democracies care for the protection of minorities?
- Student handout 7.3: Task: drafting a statute for the sports club
- Student handout 7.4: Record of group presentations: draft statutes for a micro-community
- Student handout 8.1: Suggestions for a debating issue
- Student handout 8.2: Rules for debating
- Student handout 8.3: Planning sheet for the debating teams
- Student handout 8.4: Planning sheet for the chairpersons
- Student handout 8.5: Record sheet for the audience
- Student handout 8.6: Worksheet for news story writers
- Student handout 9.1: Creating a wall newspaper - making choices
- Student handout 9.2: Tips for producing a wall newspaper
- Student handout 9.3: Tips for writing a good news story
- Exploring Children’s Rights (V)
- Introduction: What the nine units have to offer (Class 1– 9)
- Part 1: Lesson plans
- Unit 1 (Primary school, Class 1) - I have a name – we have a school
- Unit 2 (Primary school, Class 2) - Names are more than just letters!
- Unit 3 (Primary school, class 3) - We are wizards!
- Unit 4 (Primary school, Class 4) - Our rights - our treasure
- Unit 5 (Primary school, Class 5) - We make rules for our classroom
- Unit 6 (Primary school, Class 6) - Children's rights: a work of art!
- Unit 7 (Primary school, Class 7) - Is what I want also what I need?
- Unit 8 (Primary school, Class 8) - Children's rights - thoroughly researched
- Unit 9 (Primary school, Class 9) - Why must we obey rules?
- Part 2: Background information
- 1. Frequently asked questions about the children's rights convention
- 2. Children's rights - part of the human rights process
- 3. How children's rights were created
- 4. Children's rights: experiencing, getting to know and implementing them
- 5. Pedagogical approach: learning by example
- 6. Task-based learning: accompanying learning
- 7. Teaching children's rights: key questions to guide the choice of teaching methods
- 8. "But that means that I have the right to have a break, doesn't it?" - Children's rights in the classroom
- Part 3: Documents and Teaching Materials
- Teaching Democracy (VI)
- Introduction
- Chapter 1 - Building up classroom atmosphere
- Chapter 2 - Clarifying values
- Chapter 3 - Getting to know human rights
- Chapter 4 - Perceiving others
- Exercise 4.1. - All different, all equal
- Exercise 4.2. - Difference
- Exercise 4.3. - True and false
- Exercise 4.4. - First impressions
- Exercise 4.5. - We all have prejudices
- Exercise 4.6. - We are all equal, but some are more equal than others
- Exercise 4.7. - The tourists
- Exercise 4.8. - Globingo: "A human being is part of the whole world".
- Chapter 5 - Making justice work
- Chapter 6 - Understanding political philosophy
- Chapter 7 - Taking part in politics
- Exercise 7.1. - The wall of silence
- Exercise 7.2. - My feelings about dictatorship
- Exercise 7.3. - Questionnaire on attitudes to change
- Exercise 7.4. - The planning project6
- Exercise 7.5. - We and the world
- Exercise 7.6. - Should we take part in politics?
- Exercise 7.7. - How does government affect your life?
- Exercise 7.8. - Ways of participating in democracy
- Exercise 7.9. - The policy cycle
- Chapter 8 - Dealing with conflict
- Exercise 8.1. - Win-win solutions
- Exercise 8.2. - A structured approach to conflict resolution
- Exercise 8.3. - Family and peer conflict
- Exercise 8.4. - Brainstorming session on conflict and peace
- Exercise 8.5. - The statues
- Exercise 8.6. - Punishment versus positive conflict resolution
- Exercise 8.7. - Minorities
- Exercise 8.8. - Images of war and peace
- Illustrations